Panel engineering
Work inside the company's main marketing panel, a React codebase with years of history and many contributors: a guard that stops saves landing on the wrong brand, one empty-state system across 11 dashboards, an app push dashboard with a send-time heatmap, and a global search box.
- Hundredscommits, Oct 2023 – Sep 2026
- 119files created
- 11dashboards unified
- 228EN/TR keys added
Four pieces of the panel
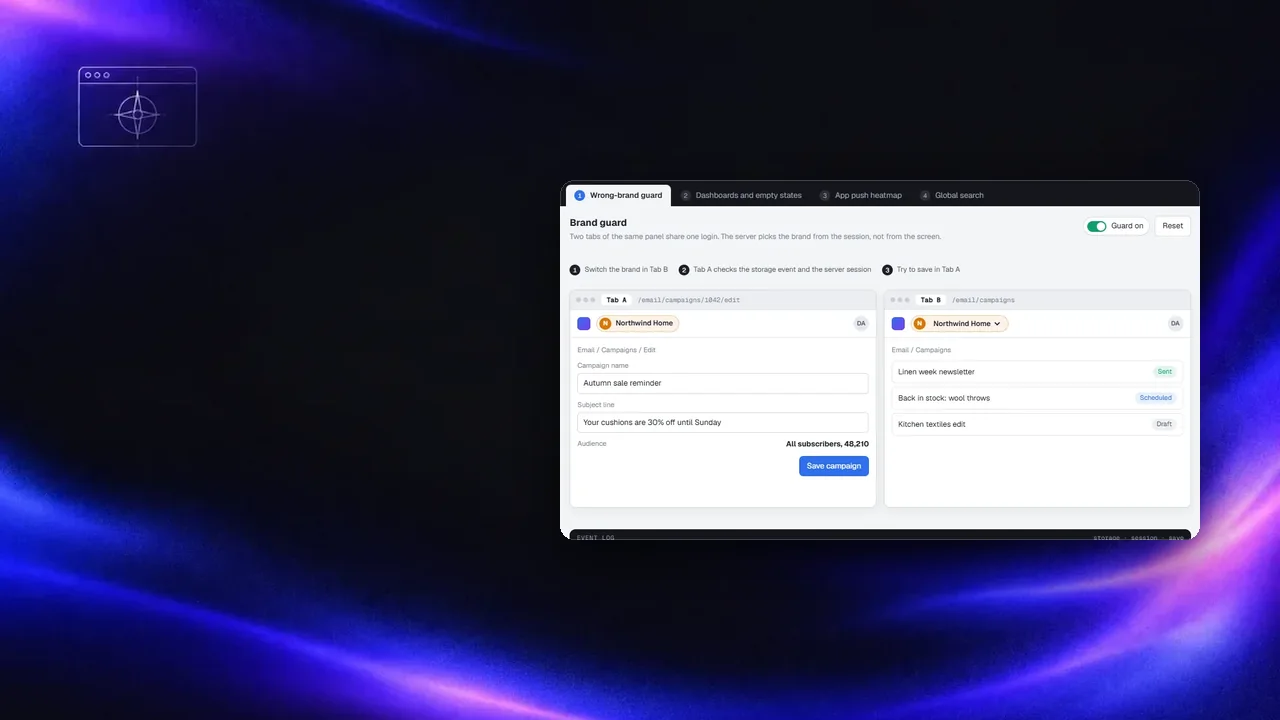
Start with "Wrong-brand guard": switch the brand in one tab and try to save in the other. Then turn the guard off.
Problem
Staff often have several brands open in different tabs. When the session switched brand in one tab, another tab could still show the old brand and save into the new one.
Around it, the panel had grown dashboard by dashboard: different loading logic, charts that stayed blank or spun forever when there was no data, inline chart heights, mixed heading levels and untranslated strings.
My role
Across three years in this codebase I built and extended features in on-site widgets, personal search, email, app push, ecommerce and admin. The pieces on this page are ones I created:
- Admin bridge that hands a workspace into the panel, and a session guard that blocks a tab whose brand disagrees with the server session or another tab
ChartContainerandNoDataPlaceholder, rolled out across 11 dashboards with fixed loading logic and 228 translation keys- App push dashboard: line and pie charts, send-time heatmap, stat tiles, campaign results
- Global search with a categorised dropdown, and splitting the monolithic route file into feature modules
What was hard and what I did
Block the tab, not the user
The guard compares the brand on screen with other tabs and with the server session. On a mismatch it covers the tab and asks for a reload instead of letting a save go through. A data-integrity bug fixed in the UI layer, where it was happening.
One component for "no data"
Every dashboard now wraps its charts in the same container and shows the same placeholder. In the same pass I fixed inverted loading flags, moved chart heights to CSS and standardised headings.
Translate as you touch it
The dashboard pass added 114 keys in each of English and Turkish, so every string I moved also became translatable.
Routes by feature
One route file had grown to cover everything. I split it into modules for email, personal search, recommendations, on-site widgets and web push, which made later features smaller diffs.
Heatmap for send times
The push dashboard plots opens by weekday and hour next to totals and a campaign table. The heatmap still runs on sample data until the backend exposes hourly opens.
Small, reviewable changes
With many people committing, I kept changes scoped to the feature, followed the branch rules and fixed crashes reported by error monitoring without touching unrelated screens.
Notes on this post
Join in
Leave a comment.
Sign in to add your note to this post.
Only your name and avatar are used.