Motion graphics, written as code
How the animated drawings on this site are made: SVG scenes on one clock, generated by short functions, written with Claude Code. With the real scenes running in the page.
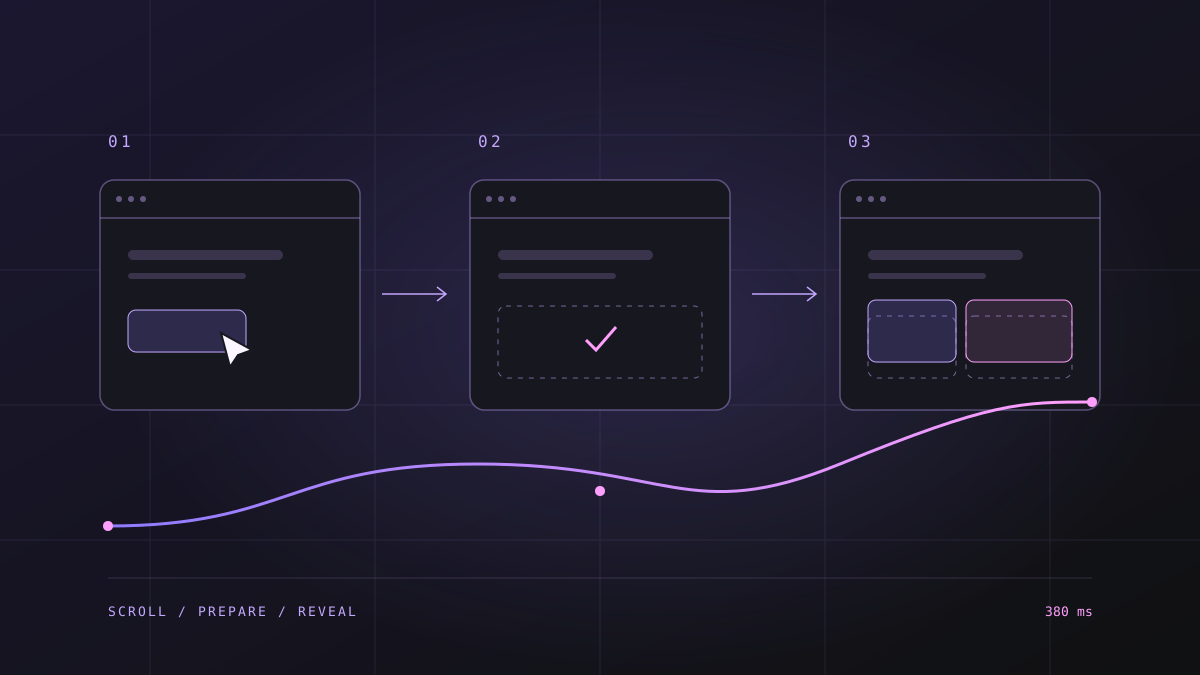
On October 8, 2026 Anthropic put Claude Motion into beta: you describe an explainer, and Claude builds the animation as code instead of generating video. Words, numbers and timing stay editable, because nothing is baked into pixels.
I didn't use that product for this site. I used the idea. Every animated drawing here was written by Claude Code inside my repository, under my direction, as plain SVG with a timeline. This post shows how, with the real scenes running in the page.
Why I threw out the first version
The home page had a grid of small "live demos": a fake chat streaming an answer, a fake terminal running tests, a fake approval dialog. They were miniature user interfaces drawn in HTML.
They looked like every AI-built landing page. A mock UI asks you to read it as a screenshot, and then it isn't one. I replaced all of them with drawings that show the mechanism instead of imitating the screen.
This is the CI gate from that grid. Six suites go green in order, then the run exits 0:
One clock per scene
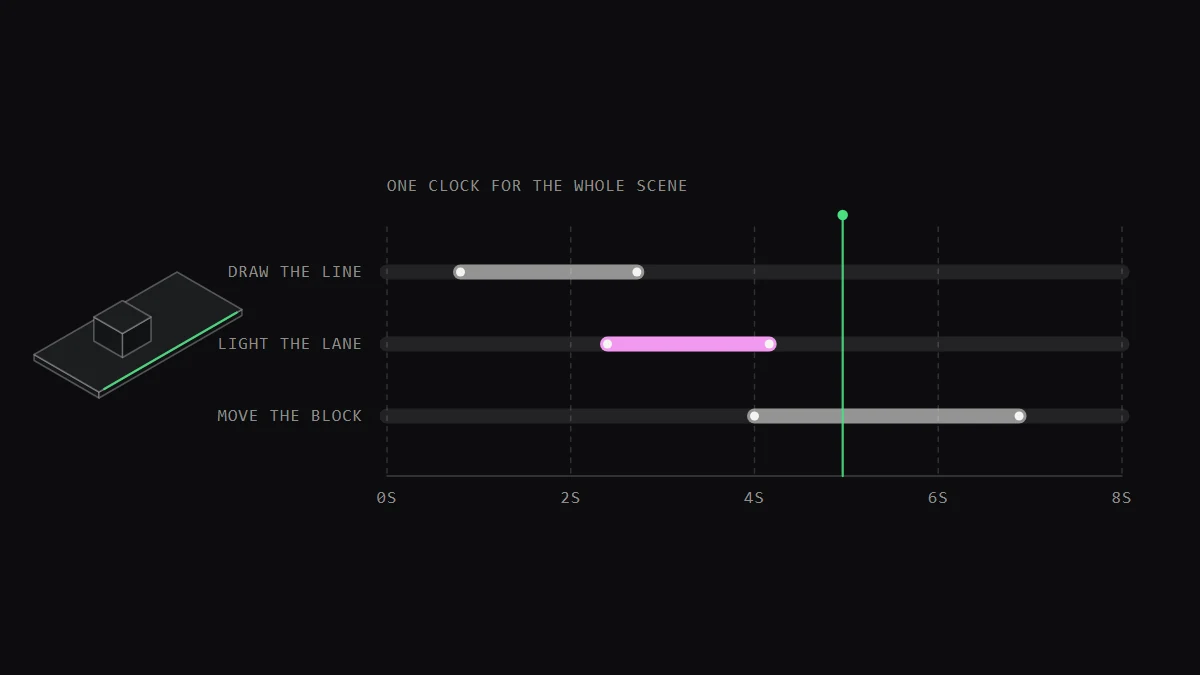
A scene is a list of elements, and each element has its own track of keyframes: when it appears, when it moves, when it changes colour. All tracks in a scene share one duration.
That single rule is what makes a loop clean. Everything resets in the same instant, so the scene restarts as a whole instead of drifting out of step.
The browser does the animating. Each element carries a SMIL <animate> or <animateTransform> child with key times between 0 and 1:
<g opacity="0">
  <animate attributeName="opacity" dur="7s" repeatCount="indefinite"
           keyTimes="0;0.03;0.07;0.9;0.96;1" values="0;0;1;1;0;0"/>
  <g>
    <animateTransform attributeName="transform" type="translate" dur="7s"
           repeatCount="indefinite" keyTimes="0;0.07;0.36;0.42;1"
           values="0 0;0 0;109.1 -63;102.2 -59;102.2 -59"/>
    <!-- the block's three faces -->
  </g>
</g>
No animation library and no canvas. The whole runtime is 17 lines in the site script: pause every scene that is off screen, and for visitors who ask for reduced motion, hold a late frame instead of playing.
A scene is a short function
Nobody writes those key times by hand. A kit of 43 lines turns isometric coordinates into paths and wraps the timeline calls: box, drawn, shown, move.
This is the scene on my 404 page, simplified. A block walks down a lane that ends before the destination, stops at the edge and turns amber:
const lost = (t, options) => {
  const P = iso(430, 70);          // isometric projection with an origin
  const D = 7;                     // the scene's one clock, in seconds
  let out = box(P, 0, 110, 0, 60, 170, 4);              // the lane
  const cube = (cls) => box(P, 18, 244, 4, 24, 24, 18, cls);
  out += actor(
    move([[0.07, [0, 0]], [0.36, [109, -63]], [0.42, [102, -59]]], D),
    cube('') + shown(cube(' is-warn'), 0.44, D),        // amber overlay
  );
  out += shown(text(left(P, 0, 118, 4), '404', 'end'), 0.46, D);
  return svg('lost', W, H, out, options);
};
And this is what that function draws:
State changes are overlays. The block doesn't change colour; an amber copy fades in on top of it. That keeps every element's own track trivial, usually one opacity curve.
The working loop
Making a scene takes four steps, and only the first one is mine alone:
- I say what the scene must show, in one sentence. "The widget arrives before the value is saved, then with the fix it waits for an event."
- Claude Code writes the function with the kit and registers it with labels in English and Turkish.
- A script freezes the scene at a chosen frame and takes a screenshot. A loop can't be reviewed by watching it; a still at 80% of the timeline can.
- I fix what the still shows, which is almost always a label sitting on top of something.
This scene went through that loop. It explains a race between two scripts better than the three paragraphs around it did:
The rules that keep it from becoming decoration
- One idea per scene. If the caption needs "and also", it is two scenes.
- Only the thing that carries the point moves. In the rollout grid, the plates change. The floor doesn't.
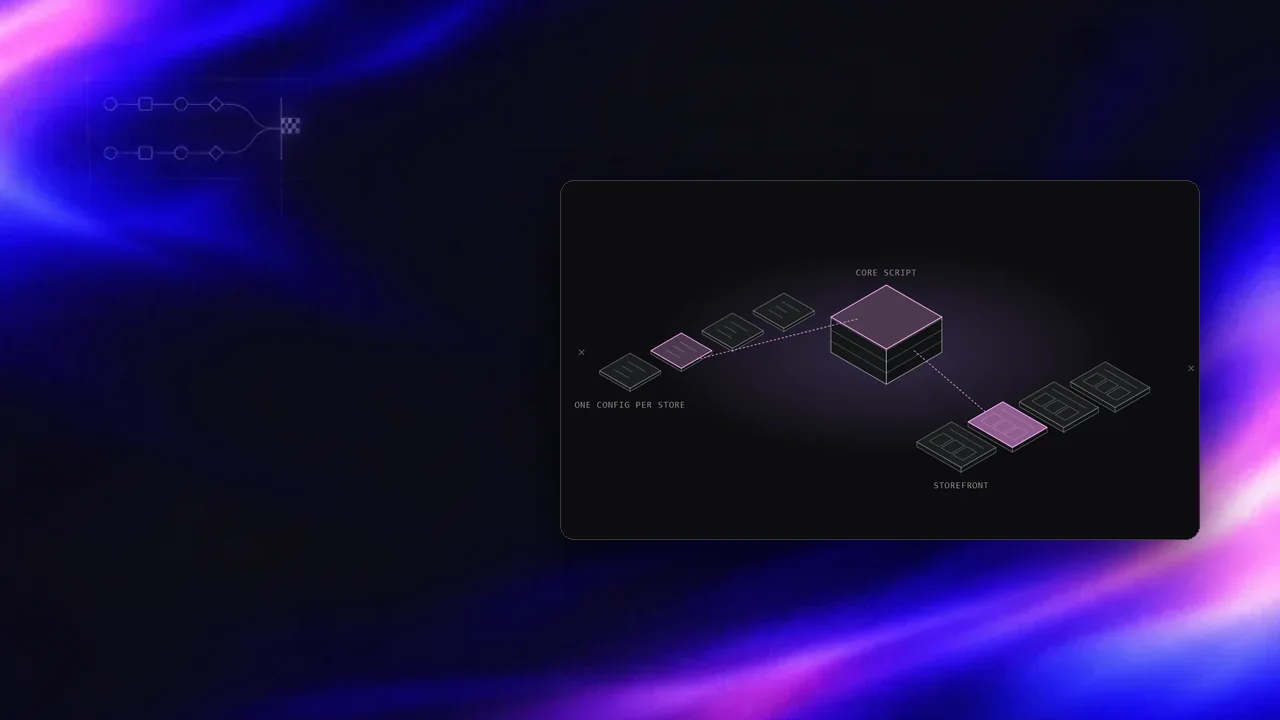
- Real numbers only. The grid says 271 of 272 because that is the count.
- The same facts in words. Every scene has a caption or a hidden paragraph that states what the loop shows. The drawing is
aria-hidden; the text is the accessible version. - Seven to eleven seconds. Long enough to read, short enough that the second pass confirms the first.
What it costs
The numbers as of today:
- 27 scenes, each built in two languages, so 54 SVG files and about 335 KB before compression.
- 689 lines of generator code in four files.
- 14 scenes on the home page, one each on the about and 404 pages, and a figure in 11 articles including this one.
- Covers for new articles are a frame of their own scene, so the card, the cover and the figure are one drawing.
The price is page weight. The home page's HTML is about 66 KB gzipped with 14 inline scenes in it. That is acceptable for a portfolio and I would not do it on a product page without loading scenes on demand.
Where it stops
This is not Claude Motion, and the differences are real.
- No export. Claude Motion gives you an MP4. These are SVGs that only run in a browser. They don't play in email or in an RSS reader.
- Labels are placed by coordinates. A longer Turkish word can collide with a line, and only a screenshot shows it.
- Small screens shrink the text. A scene drawn for 800 units is tight at 360 pixels.
- It's one visual language. Isometric line art suits mechanisms. It would be the wrong tool for a chart with forty data points.
What carries over from the product is the part I care about. The animation is a text file. I can change a number, a label or a duration in a diff, review it like code, and rebuild every scene on the site with one command.
Notes on this post
Join in
Loading…
Leave a comment.
Sign in to add your note to this post.
Only your name and avatar are used.